Bitcoin Live Graph: How to Read a Real-Time BTC Price Chart
Watch a bitcoin live graph and learn to read it: candlesticks, timeframes, volume, moving averages, log vs linear scale, and common chart-reading mistakes.
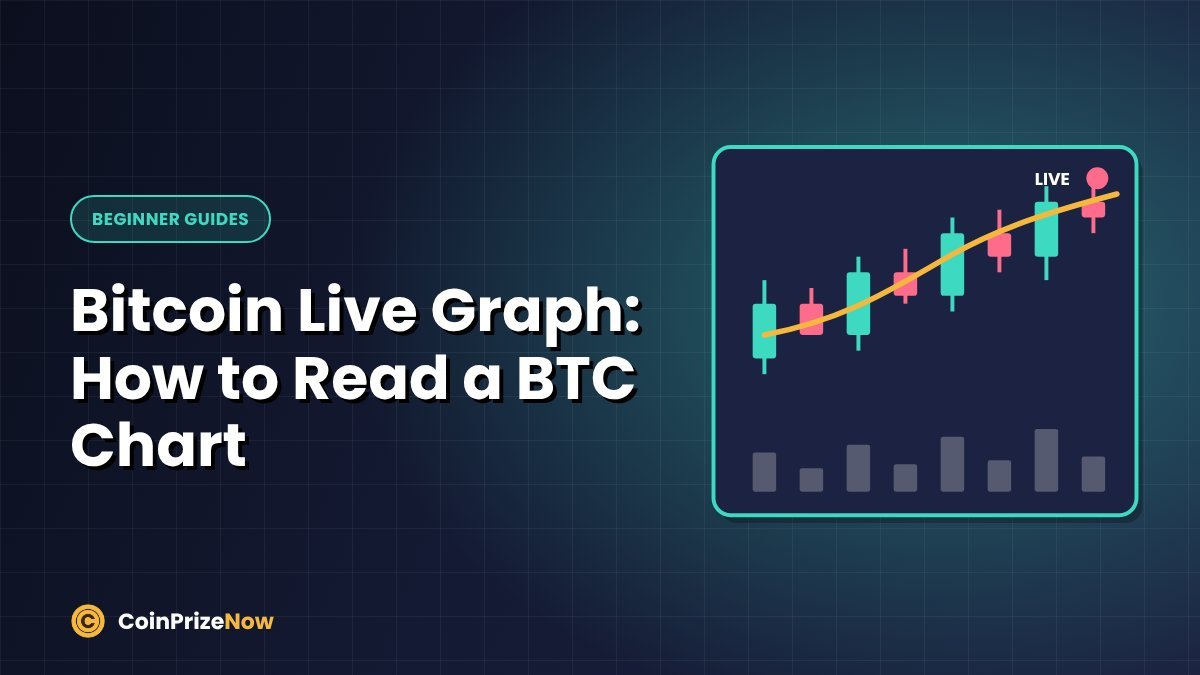
A bitcoin live graph shows how BTC's price moves in real time. It looks complicated at first — red and green bars, lines, numbers along the edges — but the basics take only a few minutes to learn. Below you'll find a live chart, followed by a plain-English guide to reading it.
Live bitcoin graph (BTC/USD)
Tip: Use the time buttons on the chart to switch between hourly, daily and weekly views. The same market can look very different depending on the timeframe.
The two axes
- Horizontal axis (x): time — minutes, hours, days or weeks, depending on your setting.
- Vertical axis (y): price — in this chart, U.S. dollars per 1 bitcoin.
The latest price usually appears as a highlighted label on the right edge.
How to read candlesticks
Most live crypto graphs use candlesticks. Each candle represents one period (for example, one hour) and shows four prices:
| Part of the candle | What it shows |
|---|---|
| Open | The price at the start of the period |
| Close | The price at the end of the period |
| High (top of upper wick) | The highest price reached |
| Low (bottom of lower wick) | The lowest price reached |
- Green (or hollow) candle: closed higher than it opened — price rose.
- Red (or filled) candle: closed lower than it opened — price fell.
- Long wicks: the price moved a lot during the period but was pushed back before closing.
Choosing a timeframe
| Timeframe | Best for |
|---|---|
| 1–15 minutes | Watching very short-term moves; very "noisy" |
| 1–4 hours | Seeing the trend over the last few days |
| Daily | Understanding the trend over weeks and months |
| Weekly / monthly | Long-term cycles and big-picture history |
Beginners often get anxious watching 1-minute charts. If you're a long-term holder, the daily or weekly chart usually gives a calmer and more useful picture.
Volume: the bars at the bottom
Volume shows how much bitcoin was traded during each period. Price moves on high volume are generally considered more significant than moves on low volume, because more traders took part.
Moving averages and other indicators
- Moving averages (MA): lines showing the average price over a set number of periods (for example, 50 or 200 days). They smooth out noise and help show the trend.
- RSI (Relative Strength Index): a 0–100 indicator some traders use to judge whether a move looks stretched.
- Support and resistance: price levels where BTC has repeatedly stopped falling or rising in the past.
Note: Indicators describe the past; they don't predict the future. Treat them as context, not as signals that guarantee anything.
Linear vs logarithmic scale
On a linear scale, every $1,000 step looks the same size. On a logarithmic (log) scale, equal percentage changes look the same size. For bitcoin's long history — from cents to tens of thousands of dollars — a log scale makes early price moves visible and is more useful for long-term charts.
Common chart-reading mistakes
- Over-reacting to tiny timeframes. A red 5-minute candle means very little for a long-term holder.
- Seeing patterns that aren't there. Our brains love patterns; markets are often random in the short term.
- Trusting screenshots from strangers. Charts shared in groups can be cropped or edited to support a sales pitch.
- Trading with leverage based on a chart "signal". This is how many beginners lose money quickly.
Where else to view a bitcoin live graph
Most exchanges and price trackers offer live BTC charts, and charting platforms provide more advanced tools. Prices can differ slightly between sources — our guide to the price of 1 bitcoin explains why.
Frequently asked questions
Is the bitcoin live graph the same everywhere?
Very close, but not identical. Each exchange has its own trades, so tiny price differences are normal.
Which timeframe should beginners use?
The daily chart is a good starting point. It filters out noise while still showing recent trends.
Can a chart tell me when to buy bitcoin?
No chart can reliably predict the future. Charts help you understand what has happened; decisions should also consider your goals and how much risk you can afford.
Key takeaway
A bitcoin live graph shows price over time using candlesticks, with volume below. Pick a timeframe that matches your goals, use indicators as context rather than predictions, and avoid making emotional decisions based on short-term wiggles.
Educational content only. This article is for general information and is not financial, investment, tax or legal advice. Crypto assets are highly volatile and you can lose money. Always do your own research and never share your seed phrase or private keys. Read our full disclaimer.